Melbis web service optimization
A practical example of optimizing a web service that, according to the user, "crashes and is slow."
Application system: Melbis Shop 6.1.1. Two servers operate together:
MB: Gigabyte H81M-DS2V CPU:Intel(R) Core(TM) i3-4170 CPU @ 3.70GHz, 4 cores. RAM: 16GB; Network: eth0: RTL8168evl/8111evl 1GB for the external IP, eth1 Intel(R) PRO/1000 internal (192.168.0.0/24). HDD:
$ df -h
Filesystem      Size  Used Avail Use% Mounted on
/dev/md1        894G  566G  283G  67% /
tmpfs           7.8G     0  7.8G   0% /dev/shm
/dev/md0        772M  146M  570M  21% /boot
/dev/sdc1       106G  3.8G   97G   4% /ssd01       <<< SSD
tmpfs           2.0G  1.6G  428M  80% /tmpfs
$ cat /proc/mdstat
Personalities : [raid1]
md0 : active raid1 sda1[0] sdb1[1]
      819136 blocks super 1.0 [2/2] [UU]

md1 : active raid1 sdb2[1] sda2[0]
      952188928 blocks super 1.1 [2/2] [UU]
      bitmap: 2/8 pages [8KB], 65536KB chunk
#
/dev/sda - Hitachi Ultrastar A7K2000
/dev/sdb - Hitachi Ultrastar A7K2000

# hdparm -tT /dev/md1
 Timing cached reads:   11260 MB in  2.00 seconds = 5633.72 MB/sec
 Timing buffered disk reads: 350 MB in  3.08 seconds = 113.72 MB/sec
Soft: CentOs 6.7 Nginx 1.10.0 Apache 2.2.22 Php 5.4.45 ISP Panel
MB: Intel DH61WW CPU: Intel(R) Core(TM) i5-3570K CPU @ 3.40GHz, 4 cores. RAM: 8GB; Network: eth0:Intel(R) PRO/1000 GB for the external IP, eth1:Intel(R) PRO/1000 GB internal (192.168.0.0/24)
HDD:
-bash-4.1# df -h
Filesystem      Size  Used Avail Use% Mounted on
/dev/sda2       106G   25G   77G  25% /
tmpfs           3.8G     0  3.8G   0% /dev/shm
/dev/sda1       976M   91M  835M  10% /boot
#
/dev/sda = INTEL SSDSC2BW120H6
#
# hdparm -tT /dev/sda2
 Timing cached reads:   19040 MB in  2.00 seconds = 9531.36 MB/sec
 Timing buffered disk reads: 720 MB in  3.00 seconds = 239.80 MB/sec
Soft: CentOs 6.7 MySQL 5.5.48 ISP Panel
The server has one database. Table type: MyISAM; 95 tables, 6,530,002 records, size 3.1 GB.
+--------------------------------+------------+
| table_name                     | table_rows |
+--------------------------------+------------+
| ms_user_log                    |    3567425 |
| ms_client_field_value          |    1125806 |
| ms_order_client_field          |     277299 |
| ms_files_store                 |     244015 |
| ms_store_info                  |     235064 |
| ms_topic_store                 |     163000 |
| ms_order_option_set            |     151254 |
| ms_tws_search                  |     132741 |
| ms_client                      |     108638 |
| ms_store                       |      57002 |
| ms_u_info_value                |      54582 |
| ms_order_store                 |      33918 |
| ms_order_store_option          |      30381 |
| ms_order_version               |      25209 |
| ms_orders                      |      25190 |
| ms_tmp_client                  |      21292 |
| ms_store_set                   |      17478 |
| ms_tmp_store                   |      10141 |
| ms_info_value                  |       4901 |
| ms_u_store_info                |       3832 |
| ms_store_comment               |       3755 |
| ms_tws_waitlist                |       3187 |
| ms_topic                       |       3044 |
| ms_u_topic_store               |       2206 |
| ms_files_topic                 |       1975 |
| ms_u_files_store               |       1756 |
| ms_u_store                     |       1100 |
| ms_brand                       |        890 |
| ms_alt_topic                   |        866 |
+--------------------------------+------------+
Nginx serves static content, while Apache processes dynamic content. A separate i.domain.com domain is used for images and is located on the same server. The MySQL server opens port 3306 only on the internal interface.
Problem No. 1
Description: Nginx returned 502 or 504 errors approximately once every 10–15 minutes. The customer addressed the issue by restarting the httpd service.
The server with the active issue showed this many httpd processes:
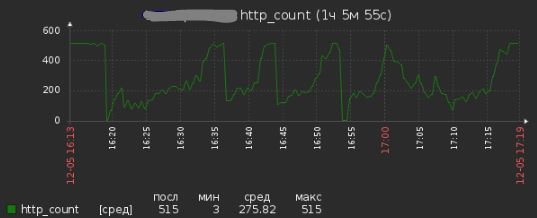 A peak at 515 means Nginx failed; a drop to 0 means the httpd service was restarted.
The Melbis Shop project had 7 crontab jobs (/var/spool/cron/root):
# time and values are examples
*/5 * * * * /usr/bin/wget -qO- http://domain.com:81/cron.php?exp=value1 >/dev/null 2>&1
*/5 * * * * /usr/bin/wget -qO- http://domain.ua:81/cron.php?exp=value2 >/dev/null 2>&1
The purpose of these jobs was unknown, but their periodicity clearly matched when the server "crashed," according to the customer. It was unclear how long each job took.
Step 1. 1. Spaced the cron jobs 10 minutes apart. 2. Asked the developer, through the customer, to log the start and finish time of every job.
Readings after step 1, on the same day:
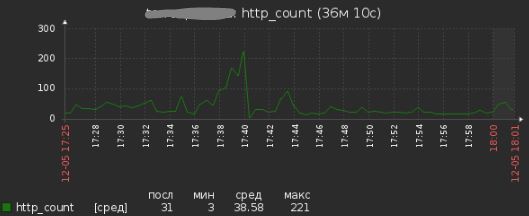
Step 2. 1. After discussing it with the customer, stopped using Apache to run cron scripts and switched to PHP.
2 * * * *  /var/www/domain.com/cron.sh value1 >/dev/null 2>&1
*/15 * * * *  /var/www/domain.com/cron.sh value2 >/dev/null 2>&1
2. Made Nginx wait a little longer for dynamic content from Apache.
# /etc/nginx/conf
server {
  server_name domain.com;
  ...
  proxy_connect_timeout 300s;
  proxy_send_timeout 300s;
  proxy_read_timeout 300s;
  ...
}
3. Obtained cron-job start and finish times from the log. This confirmed that jobs overlapped. The response time of one process grew, followed by the number of httpd processes seen by the customer. Finally, Nginx timed out.
This later proved to be the right conclusion because MySQL queries also noticeably slowed process execution.
Problem No. 2
Description: Three days later, the customer recorded an Nginx 502 error.
The monitoring looked generally healthy. We noticed a slight increase in iowait and examined the process:
$ iotop
Total DISK READ: 0.00 B/s | Total DISK WRITE: 0.00 B/s
  TID  PRIO  USER     DISK READ  DISK WRITE  SWAPIN     IO>    COMMAND
 1542 be/3 root        0.00 B/s    0.00 B/s  0.00 % 99.49 % [jbd2/sdc1-8]
 2048 be/4 memcache    0.00 B/s    0.00 B/s  0.00 %  0.00 % memcached ...
    1 be/4 root        0.00 B/s    0.00 B/s  0.00 %  0.00 % init
    2 be/4 root        0.00 B/s    0.00 B/s  0.00 %  0.00 % [kthreadd]
The jbd2/sdc1 process was stuck at 99% for several seconds. That was enough for Nginx to return a 502 error.
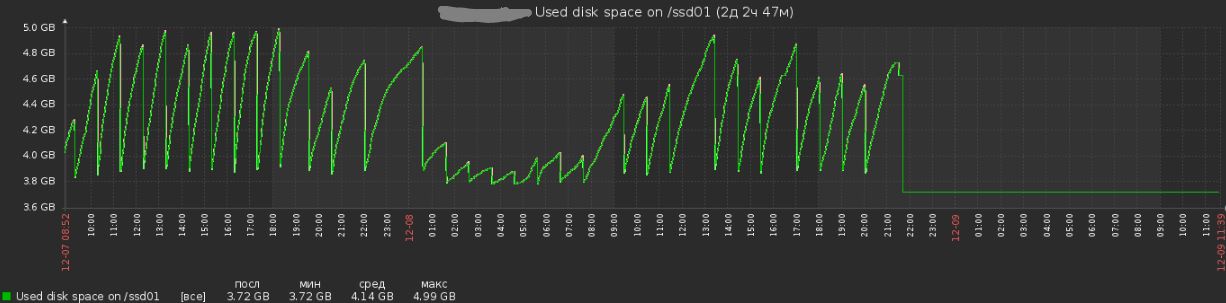
The /ssd01 mount point stored the nginx pagespeed cache. We decided not to experiment with SSDs on the production server; as it had enough memory, the cache was moved to the /tmpfs partition.
The 99% iowait load ceased because writes to that partition stopped. The SSD load graph became:
Problem No. 3
Description: The customer noticed system slowness around 17:15. We connected monitoring again and reviewed the metrics. We saw very high CPU load on the database server despite an unremarkable number of queries per second.
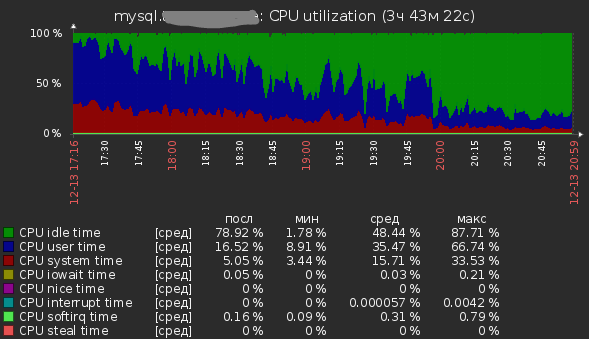
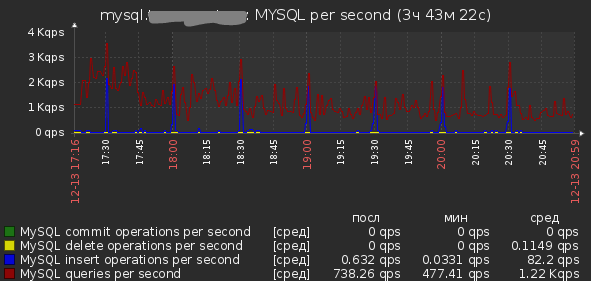 We fixed nothing, and the CPU load gradually fell.
At approximately 02:10, enabled log_slow_queries on the MySQL server. Set:
At approximately 17:00 the next day, CPU load surged again. I reviewed queries appearing in slow-queries.log, selected the most frequent ones by eye, and tested them. Many queries used tables that had no indexes except a PRIMARY index on the ID field. I do not know whether these tables once had other indexes, or whether this was simply how it happened... :)
Some notable figures and facts from slow-queries.log:
-----------------
# Query_time: 6.560914  Lock_time: 0.001897 Rows_sent: 18418  Rows_examined: 113829
# Query_time: 6.042265  Lock_time: 0.000017 Rows_sent: 3553202  Rows_examined: 3553202
# Query_time: 22.716306  Lock_time: 0.000236 Rows_sent: 31185  Rows_examined: 60824450
-----------------
# Query_time: 0.025933  Lock_time: 0.000038 Rows_sent: 1  Rows_examined: 108456
SELECT * FROM ms_client WHERE login='XXXXXX' AND pass='XXXXX';
-----------------
# Query_time: 0.150510  Lock_time: 0.000022 Rows_sent: 0  Rows_examined: 57000
UPDATE ms_store how = 0 status_key = 'kAbsent';
-----------------
# Query_time: 0.129256  Lock_time: 0.000035 Rows_sent: 0  Rows_examined: 57000
SELECT status_key FROM ms_store WHERE price =0;
# without an index
id  select_type table   type    possible_keys   key key_len ref rows    Extra
1   SIMPLE  ms_store    ALL NULL    NULL    NULL    NULL    57000   Using where
# index added
id  select_type table   type    possible_keys   key key_len ref rows    Extra
1   SIMPLE  ms_store    ref price   price   5   const   815
After adding 15–20 indexes to tables based on queries found in slow-queries.log, the red arrow approximately marks the moment they were added.
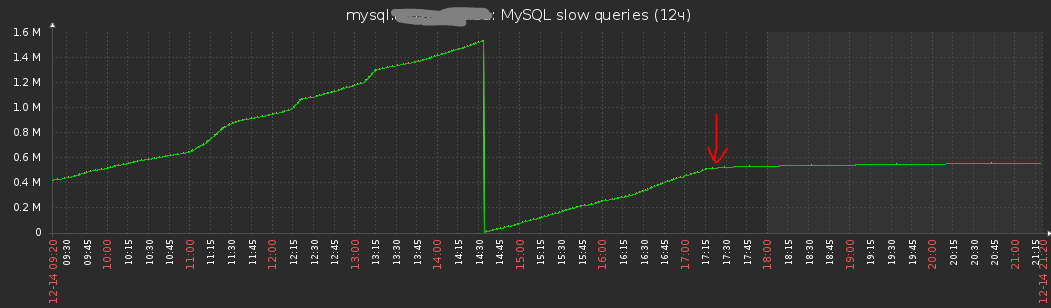
Not all slow, non-indexed queries can be fixed by adding indexes. Therefore, CPU load sometimes rises, but the service works correctly. Further query optimization was beyond our capabilities. We did not contact the developer because the customer did not ask us to.
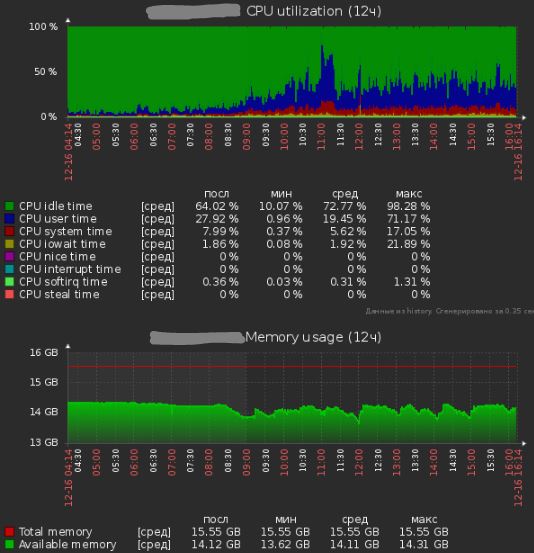
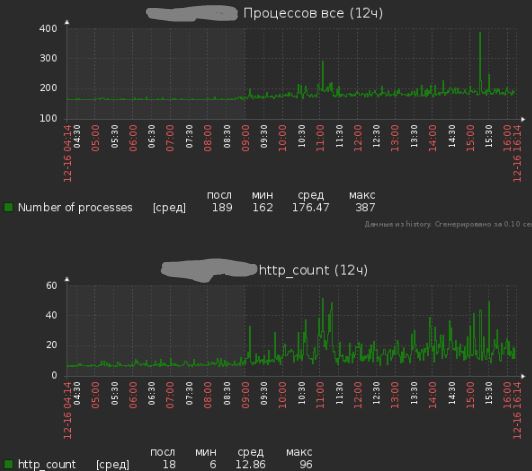
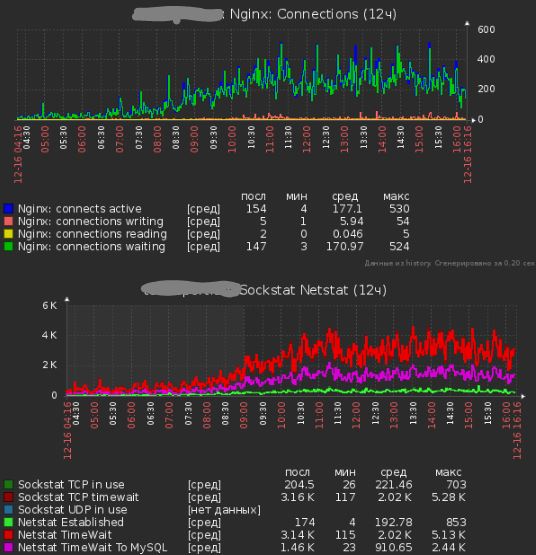
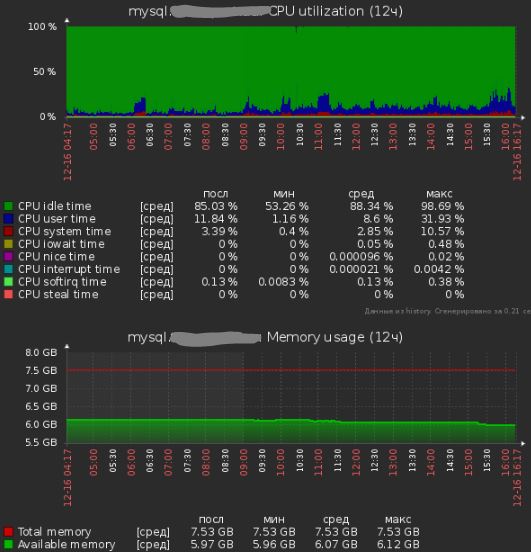
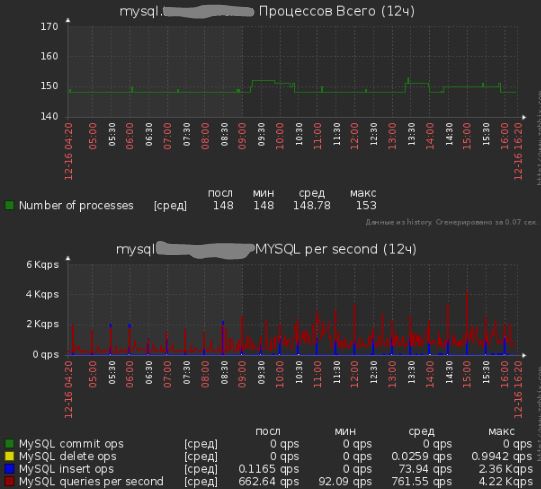
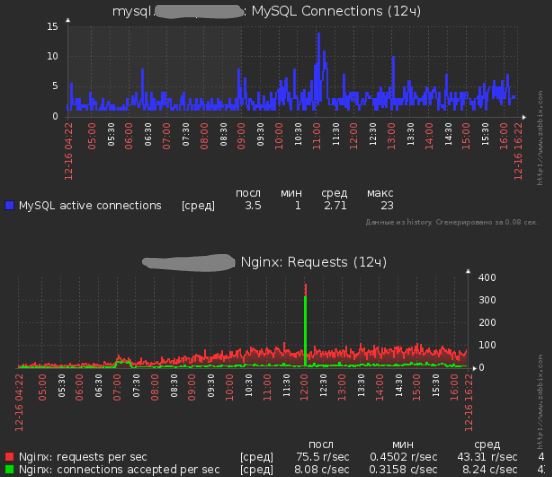
Server metrics after all fixes:
Problem No. 4
2017-03-02 23:06 mysql temp - moved to tmpfs