Wordpress too-slow
Customer: the WordPress site is slow. Physical server: 8-core CPU, 16 GB RAM, Soft RAID 10 Database dump size: 140 MB Site size on disk: 2.1G (with WP cache) Page generation time: from 15 seconds.
Metrics:
Approximately 100 concurrent users
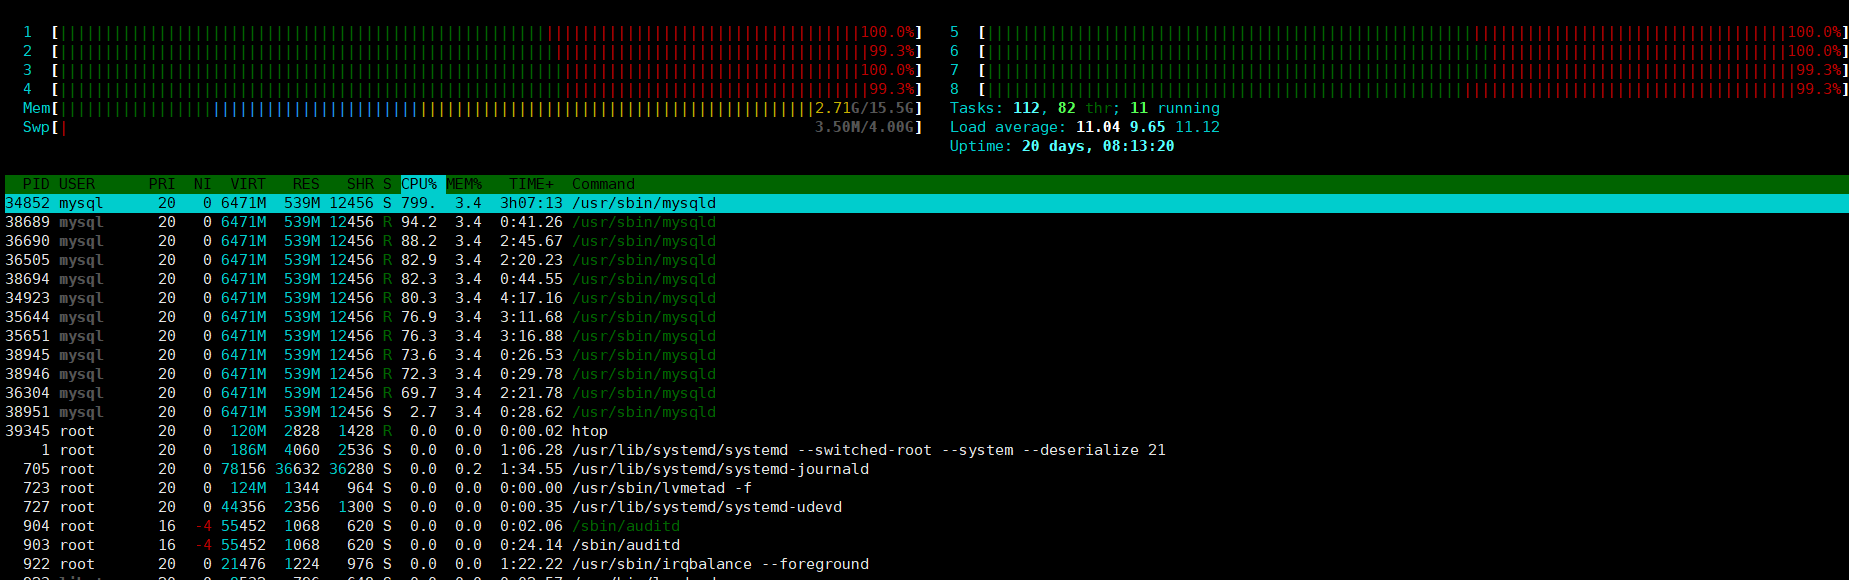
CPU usage
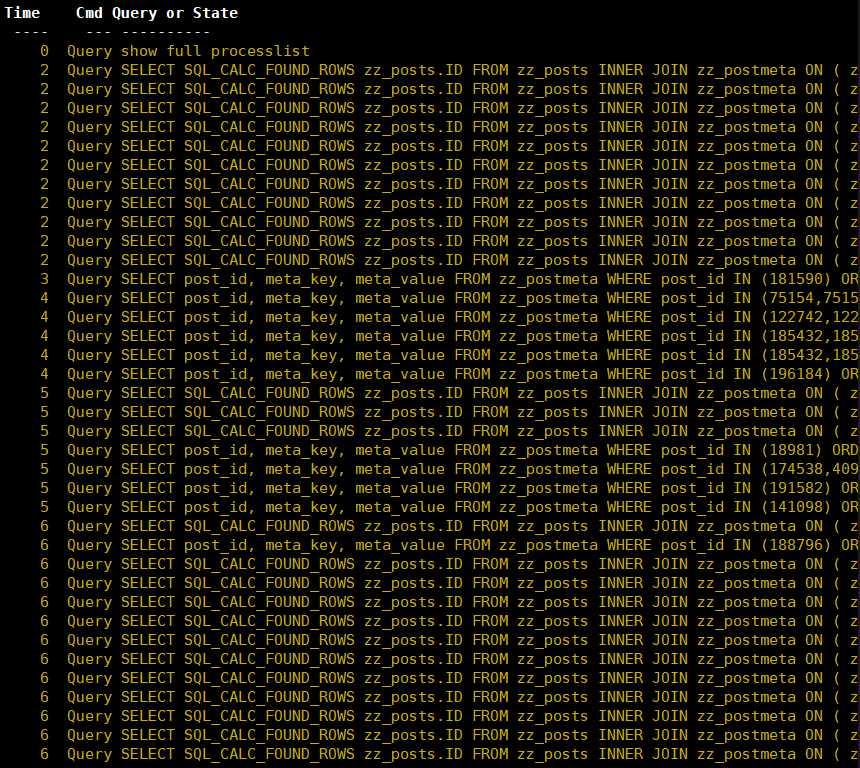
 Queries in MyTop
 Zabbix metrics.
Note the high kernel process time values (red on the CPU graph) and the average number of MySQL queries.
Zabbix metrics.
Note the high kernel process time values (red on the CPU graph) and the average number of MySQL queries.
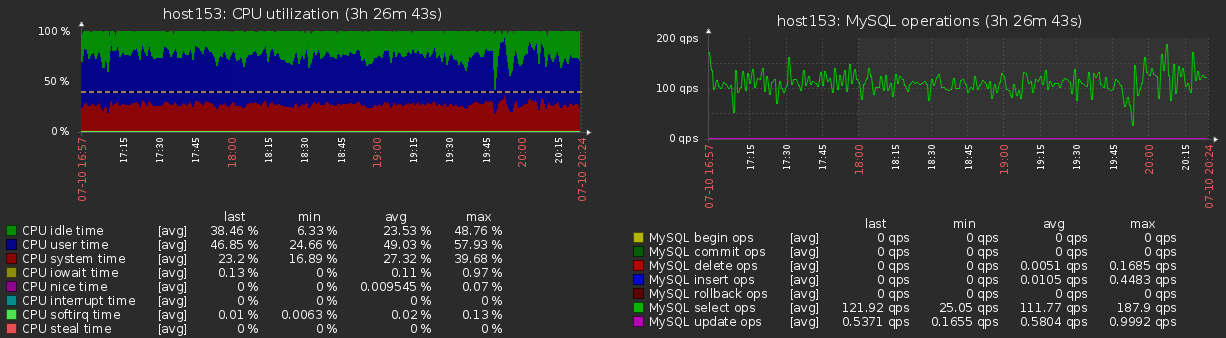 Table sizes:
+--------------------------+--------+------------+-------------+--------------+
| table_name               | ENGINE | table_rows | DATA_LENGTH | INDEX_LENGTH |
+--------------------------+--------+------------+-------------+--------------+
| zz_postmeta              | MyISAM |    1245642 |    94746048 |     41702400 |
| zz_posts                 | MyISAM |     148600 |    36695272 |     13848576 |
| zz_term_relationships    | MyISAM |      38565 |      809865 |      1587200 |
| zz_yoast_seo_meta        | InnoDB |      28758 |     2326528 |            0 |
| zz_terms                 | MyISAM |      10849 |      462468 |       911360 |
| zz_term_taxonomy         | MyISAM |      10849 |      423584 |       370688 |
| zz_usermeta              | MyISAM |       3750 |      301760 |       144384 |
| zz_options               | MyISAM |       1359 |   448094228 |       346112 |
| zz_yoast_seo_links       | InnoDB |        983 |      147456 |        65536 |
| zz_users                 | MyISAM |        235 |       26144 |        29696 |
| zz_statistics_visitor    | InnoDB |         34 |       16384 |        81920 |
| zz_ewwwio_images         | InnoDB |          9 |       16384 |        32768 |
| zz_statistics_pages      | InnoDB |          7 |       16384 |        49152 |
| zz_statistics_visit      | InnoDB |          6 |       16384 |        16384 |
| zz_commentmeta           | MyISAM |          2 |          88 |         9216 |
| zz_comments              | MyISAM |          1 |         152 |         7168 |
| zz_statistics_exclusions | InnoDB |          0 |       16384 |        32768 |
| zz_statistics_useronline | InnoDB |          0 |       16384 |            0 |
| zz_statistics_search     | InnoDB |          0 |       16384 |        49152 |
| zz_termmeta              | MyISAM |          0 |           0 |         4096 |
| zz_statistics_historical | InnoDB |          0 |       16384 |        49152 |
| zz_links                 | MyISAM |          0 |           0 |         1024 |
+--------------------------+--------+------------+-------------+--------------+
Finding a solution:
Hypothesis 1: Storage issue
Kernel process load, Soft RAID 10. Test:
# date; sync; dd if=/dev/zero of=/home/test/bigfile bs=1M count=1024; sync; date;
Mon Jul  9 20:36:43 CEST 2018
1024+0 records in
1024+0 records out
1073741824 bytes (1.1 GB) copied, 2.3009 s, 467 MB/s
Mon Jul  9 20:38:33 CEST 2018
1 minute 50 seconds is a catastrophe!
Testing:
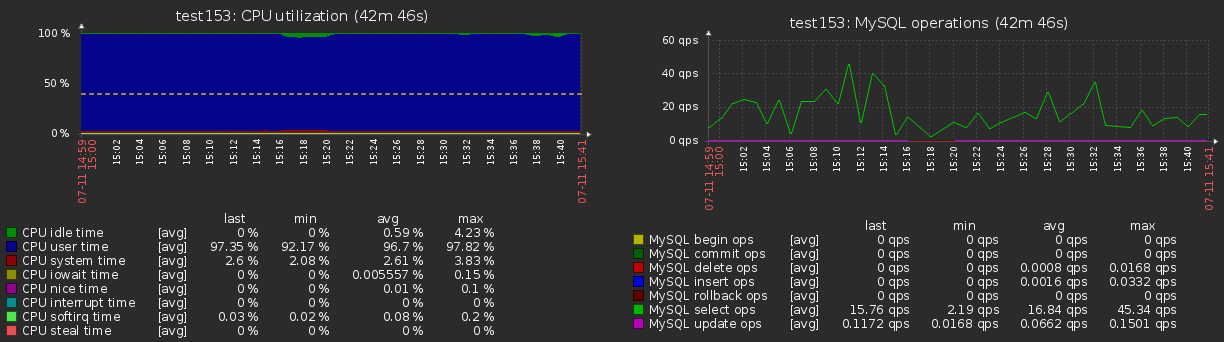
Place a copy of the site on another server with SSD storage, redirect DNS to it, and observe the load:
Conclusions:
- There is indeed a disk issue on the original server.
- The main issue remains unresolved: the mysqld processes still have the same high load (not visible on the graph).
- MySQL queries need to be analyzed.
Hypothesis 2: Unoptimized MySQL queries
Investigation:
Enable the slow-query log on the test server. Review and analyze it. Notice multiple repetitions of the following:
# Query_time: 3.142688  Lock_time: 0.000074  Rows_sent: 3  Rows_examined: 254237
# Query_time: 3.318022  Lock_time: 0.001266  Rows_sent: 3  Rows_examined: 254237
# Query_time: 4.179673  Lock_time: 0.000076  Rows_sent: 0  Rows_examined: 745311

SELECT SQL_CALC_FOUND_ROWS  zz_posts.ID FROM zz_posts  INNER JOIN zz_postmeta ON ( zz_posts.ID = zz_postmeta.post_id ) WHERE 1=1  AND (
  ( zz_postmeta.meta_key = 'dt_string' AND zz_postmeta.meta_value = 'tvhVl5BZ1402' )
) AND zz_posts.post_type = 'dt_links' AND (zz_posts.post_status = 'publish') GROUP BY zz_posts.ID ORDER BY zz_posts.post_date DESC LIMIT 0, 30;
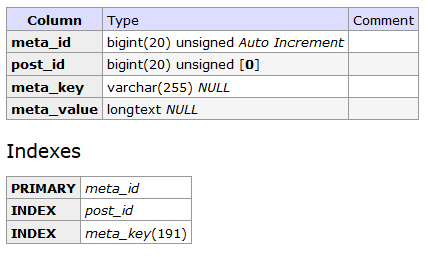
Review the indexes of the postmeta table:
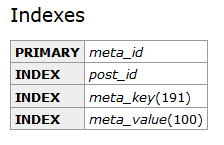
 Add another one:
 Result: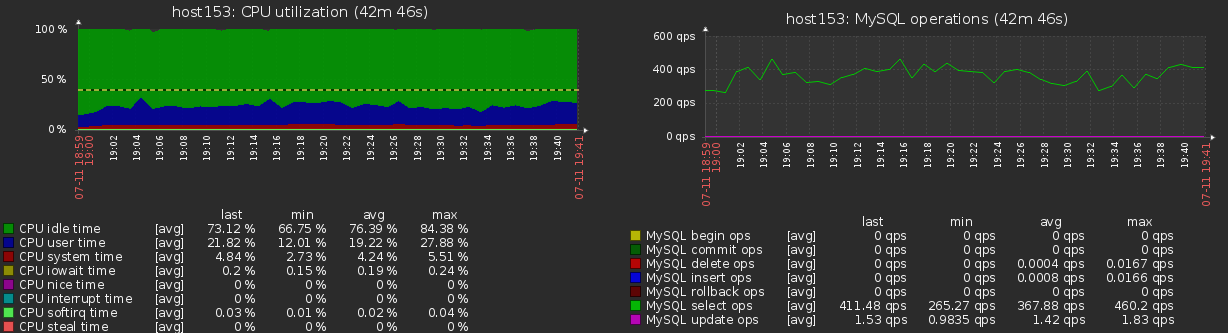
Conclusions:
- Page generation time decreased to 1.5 seconds, down from 15 seconds.
- Purchased themes and standard plugins are not always optimized.
- The customer was advised to replace the server due to unresolved storage issues.