Simpla тормозит
Задача: Необходима оптимизация интернет магазина на движке SIMPLA, имеет большое количество товара и узлов.
VPS сервер CPU: Intel(R) Xeon(R) L5640 @ 2.27GHz, 3 ядра RAM: 2GB HDD:
$ df -h
Filesystem      Size  Used Avail Use% Mounted on
/dev/xvda1       59G   32G   25G  57% /
none            935M     0  935M   0% /dev/shm
Soft:
CentOS release 6.8 (Final)
Apache/2.2.31 (Unix)
MYSQL Ver 14.14 Distrib 5.5.45
PHP 5.3.29
Webuzo
Simpla 2.1.5
База данных
Всего таблиц: 120
Обьем данных: 791 348 612
Обьем индексов: 1 052 062 720
Тип таблиц: MyIASM, InnoDB
+-------------------------------------+------------+
| table_name                          | table_rows |
+-------------------------------------+------------+
| category_product                    |   16371174 |
| s_related_products                  |    6840958 |
| s_schemes_options                   |     968797 |
| s_redirects                         |     565921 |
| categories                          |     534794 |
| s_images                            |     377772 |
| s_options_paths                     |     338352 |
| s_variants                          |     230369 |
| s_products                          |     230369 |
| s_options                           |     230368 |
| s_schemes                           |     194382 |
| s_schemes_categories                |     194361 |
| product_pictures                    |     189895 |
| product_options_values              |      97492 |
| _new_schemes_ids                    |      68955 |
| product_options_set                 |      35465 |
| s_options_relationship              |      34228 |
| discussions                         |      28946 |
| aff_sms_status                      |      19896 |
| aff_sms_text                        |       7880 |
| customer_log                        |       7181 |
| order_status_changelog              |       7107 |
| shopping_cart_items                 |       6157 |
| s_related_products_custom           |       3556 |
| related_items                       |       3385 |
| customer_reg_fields_values_quickreg |       3068 |
| category__product_options           |       2892 |
| session                             |       2601 |
| ordered_carts                       |       2219 |
| customer_reg_fields_values          |       1854 |
+-------------------------------------+------------+
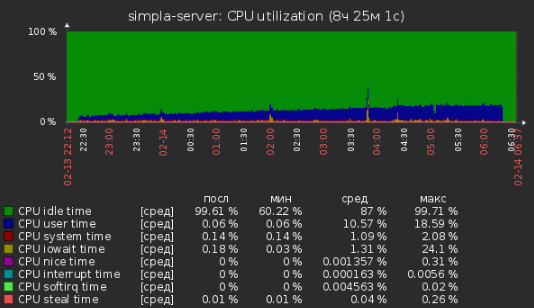
В момент подключения на сервере наблюдается:
Top показывает что все ресурсы отобрал MySQL. Смотрим, что он делает, видим запросы колосальным временем выполнения:
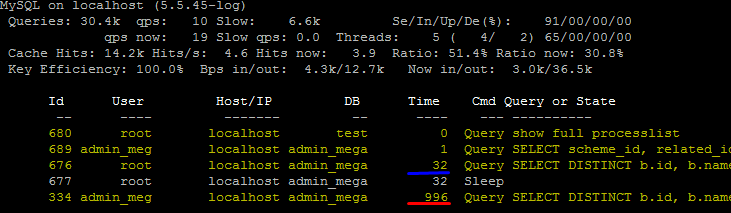
SELECT DISTINCT b.id, b.name, b.url, b.meta_title, b.meta_keywords, b.meta_description, b.description, b.image
                                        FROM s_brands b
            LEFT JOIN s_schemes s ON s.brand_id=b.id AND s.visible=1
            LEFT JOIN s_schemes_categories sc ON s.id = sc.scheme_id
            LEFT JOIN s_products p ON p.brand_id=b.id AND p.visible=1
            LEFT JOIN s_products_categories pc ON p.id = pc.product_id
            WHERE  pc.category_id in('210','214','215','216','211','212','213','204','207','208','209','217','205','206','169') OR  sc.category_id in('210','214','215','216','211','212','213','204','207','208','209','217','205','206','169') ORDER BY b.name
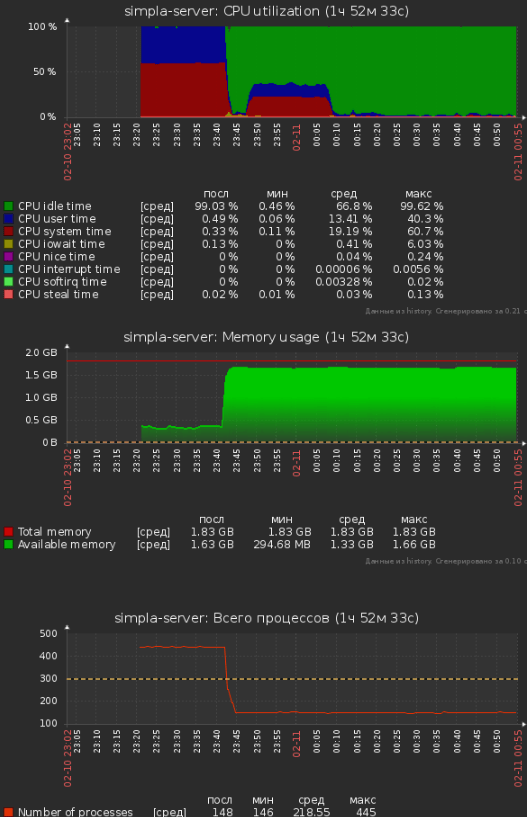
Снимаем данные процессы:
Загрузка упала. Находим конфиг MYSQL ( /usr/local/apps/mysql/etc/my.cnf) и добавляем параметры:
[mysqld]
...
long_query_time = 2.000000
log_queries_not_using_indexes = ON
log-slow-queries=/var/log/mysql_slow_queries.log
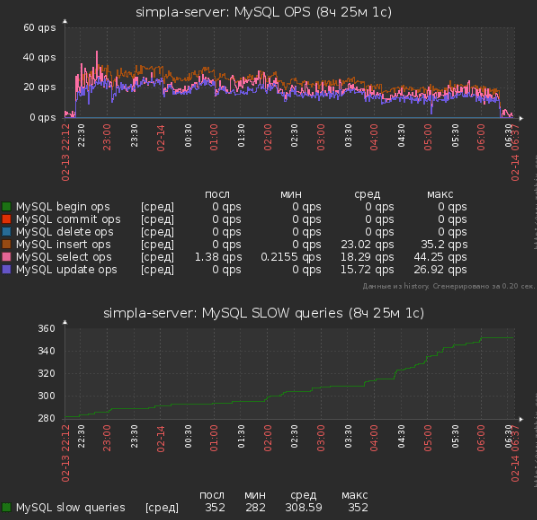
Имеем статистику в момент импорта записей в БД:
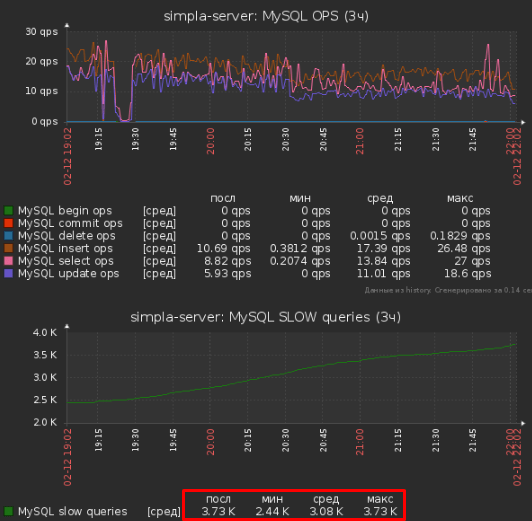
Дальнейшее наблюдение показывает, что именно эти запросы зависают в статусе "copying to tmp table".
Получим за 8 часов статистику SLOWQUERY находим в ней СТРАШНЫЕ значения:
# Query_time: 4.301706  Lock_time: 0.000200 Rows_sent: 0  Rows_examined: 230369
# Query_time: 4.602689  Lock_time: 0.000160 Rows_sent: 0  Rows_examined: 230369
# Query_time: 4.572558  Lock_time: 0.000154 Rows_sent: 0  Rows_examined: 230369
...
# Query_time: 16.692677  Lock_time: 0.000184 Rows_sent: 20  Rows_examined: 18079
# Query_time: 24.860018  Lock_time: 0.000209 Rows_sent: 31  Rows_examined: 26692
# Query_time: 24.652913  Lock_time: 0.000182 Rows_sent: 27  Rows_examined: 26676
# Query_time: 10.359431  Lock_time: 0.000195 Rows_sent: 32  Rows_examined: 14010
# Query_time: 13.080076  Lock_time: 0.000201 Rows_sent: 45  Rows_examined: 14062
# Query_time: 24.737066  Lock_time: 0.000195 Rows_sent: 32  Rows_examined: 26696
....
# Query_time: 9130.263210  Lock_time: 0.000171 Rows_sent: 0  Rows_examined: 0
# Query_time: 9300.956156  Lock_time: 0.000155 Rows_sent: 0  Rows_examined: 0
# Query_time: 9840.150401  Lock_time: 0.000155 Rows_sent: 0  Rows_examined: 0
Решение проблемы МЕРТВОГО запроса:
Нашли, что данный запрос формируется в функции Brands->get_brands() при передачи в нее фильтра по Категориям. Запрос ищет Производителей, по ВЫБРАННОЙ КАТЕГОРИИ(ЯМ), при этом он перебирает ВСЕ Товары и Узлы - то есть идет с самого нижнего уровня, а "убого" написанный query делал его невыполнимым! Спасибо SIMPL-е, что она simple! Добавили промежуточную таблицу, добавили задание в cron для ее наполнения. Переписали запрос. "Зависания" прекратились.
Решение для медленных запросов
1. Добавляем индексы, там где их нет.
2. Включаем КЕШ МySQL Было:
mysql> SHOW GLOBAL VARIABLES LIKE "%cache%";
+------------------------------+----------------------+
| Variable_name                | Value                |
+------------------------------+----------------------+
| binlog_cache_size            | 32768                |
| binlog_stmt_cache_size       | 32768                |
| have_query_cache             | YES                  |
| key_cache_age_threshold      | 300                  |
| key_cache_block_size         | 1024                 |
| key_cache_division_limit     | 100                  |
| max_binlog_cache_size        | 18446744073709547520 |
| max_binlog_stmt_cache_size   | 18446744073709547520 |
| metadata_locks_cache_size    | 1024                 |
| query_cache_limit            | 8388608              |
| query_cache_min_res_unit     | 4096                 |
| query_cache_size             | 67108864             |
| query_cache_type             | OFF                  |
| query_cache_wlock_invalidate | OFF                  |
| stored_program_cache         | 256                  |
| table_definition_cache       | 400                  |
| table_open_cache             | 1024                 |
| thread_cache_size            | 64                   |
+------------------------------+----------------------+
Включили:
Стало:
mysql> show global status like 'Qcache%';
+-------------------------+-----------+
| Variable_name           | Value     |
+-------------------------+-----------+
| Qcache_free_blocks      | 1         |
| Qcache_free_memory      | 267251352 |
| Qcache_hits             | 819       |
| Qcache_inserts          | 590       |
| Qcache_lowmem_prunes    | 0         |
| Qcache_not_cached       | 155       |
| Qcache_queries_in_cache | 590       |
| Qcache_total_blocks     | 1209      |
+-------------------------+-----------+
Проблема медленной работы дисковой подсистемы
Замер скорости дисковой подсистемы (3 подряд) Провайдер в тарифном плане говорит что это SSD.
$ hdparm -Tt /dev/xvda1
/dev/xvda1:
 Timing cached reads:   9460 MB in  1.99 seconds = 4752.16 MB/sec
 Timing buffered disk reads: 208 MB in  3.03 seconds =  68.71 MB/sec

$ hdparm -Tt /dev/xvda1
/dev/xvda1:
 Timing cached reads:   10070 MB in  1.99 seconds = 5060.94 MB/sec
 Timing buffered disk reads:  88 MB in  3.10 seconds =  28.36 MB/sec

$ hdparm -Tt /dev/xvda1
/dev/xvda1:
 Timing cached reads:   10912 MB in  1.99 seconds = 5484.02 MB/sec
 Timing buffered disk reads: 206 MB in  3.08 seconds =  66.88 MB/sec
Замер скорости на ДРУГОМ SSD хостинге:
$ hdparm -Tt /dev/dm-0
/dev/dm-0:
 Timing cached reads:   12940 MB in  2.00 seconds = 6473.92 MB/sec
 Timing buffered disk reads: 1506 MB in  3.00 seconds = 501.75 MB/sec

$ hdparm -Tt /dev/dm-0
/dev/dm-0:
 Timing cached reads:   10996 MB in  2.00 seconds = 5501.11 MB/sec
 Timing buffered disk reads: 1894 MB in  3.01 seconds = 628.98 MB/sec

$ hdparm -Tt /dev/dm-0
/dev/dm-0:
 Timing cached reads:   10172 MB in  2.00 seconds = 5088.74 MB/sec
 Timing buffered disk reads: 2026 MB in  3.00 seconds = 675.25 MB/sec
Пост-фактум: Текущий провайдер предложил перейти на другой сервер. :)
Уменьшили границу медленного запроса до 0.8 секунд:
mysql> show global variables like '%long_query%';
+-----------------+----------+
| Variable_name   | Value    |
+-----------------+----------+
| long_query_time | 0.800000 |
+-----------------+----------+
День закончился, оставили на ночь процесс импорта.
За ночь после всех изменений
Процесс импорт за ночь набрал около 80 медленных запросов = 10 шт/час. Показатель до начал работ (примерно) 700 за 3 часа = 233шт/час.